Advanced FIS configuration
This document summarizes the advanced configuration options available for Fuzzy Inference Systems.
For a general background on the components of Fuzzy Inference Systems, you can check out MatWorks’s documentation at https://www.mathworks.com/help/fuzzy/fuzzy-inference-process.html
[1]:
import zadeh
import matplotlib.pyplot as plt
TODO: This guide is currrently being edited and does reflect the current development status.
Logical operators
By default, the zadeh package uses the most common definitions for the logical operators of fuzzy logic. In terms of membership funtion values:
Python notation |
Logical notation |
Interpretation |
|---|---|---|
~X |
NOT X |
x: 1-x |
X|Y |
X OR Y |
x, y: max(x, y) |
X&Y |
X AND Y |
x, y: min(x, y) |
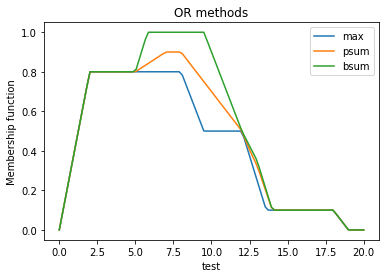
However, there are different conventions available to construct a fuzzy logic. We typically want the operators to obey the De Morgan law. A De Morgan triplet is a triplet \((\top, \bot, \neg)\) ensuring such a thing, as well as other important considerations. In most of the cases the standard negator is kept, and the other two are related by a duality transformation. The following table describes the common choices available in the package.
T-Norm (AND) |
T-conorm (OR) |
||||
|---|---|---|---|---|---|
Name |
Python |
\[\top(a,b)\]
|
Name |
Python |
\[\bot(a,b)\]
|
Minimum |
min |
\[\min \{ a,b \}\]
|
Maximum |
max |
\[\max\{a,b\}\]
|
Product |
product |
\[a\cdot b\]
|
Probabilistic sum |
psum |
\[1-(1-a)(1-b)\]
|
Łukasiewicz |
lukasiewicz |
\[\max\{0, a + b - 1\}\]
|
Bounded sum |
bsum |
\[\min\{1,a+b\}\]
|
[2]:
for method in ["max", "psum", "bsum"]:
    with zadeh.set_fuzzy_context(zadeh.FuzzyContext(OR=method)):
        test = zadeh.FuzzyVariable(
            zadeh.FloatDomain("test", 0, 20, 100),
            {
                method: 0.8 * zadeh.TrapezoidalFuzzySet(0, 2, 8, 12)
                | 0.5 * zadeh.TrapezoidalFuzzySet(5, 7, 12, 14)
                | 0.1 * zadeh.TrapezoidalFuzzySet(12, 13, 18, 19),
            },
        )
        test.plot()

plt.title("OR methods")
plt.show()
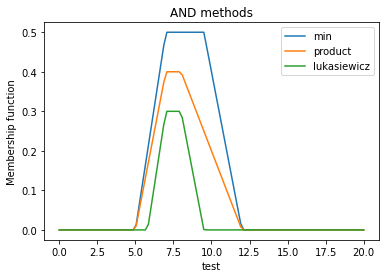
[3]:
for method in ["min", "product", "lukasiewicz"]:
    with zadeh.set_fuzzy_context(zadeh.FuzzyContext(AND=method)):
        test = zadeh.FuzzyVariable(
            zadeh.FloatDomain("test", 0, 20, 100),
            {
                method: 0.8 * zadeh.TrapezoidalFuzzySet(0, 2, 8, 12)
                & 0.5 * zadeh.TrapezoidalFuzzySet(5, 7, 12, 14)
            },
        )
        test.plot()

plt.title("AND methods")
plt.show()
Implication
The current version of zadeh supports only the most common definitions for the logical implication output. In terms of membership funtion values:
Python notation |
Logical notation |
Interpretation |
|---|---|---|
X >> Y |
X -> Y |
x, y: min(x, y) |
Aggregation
The current version of zadeh supports only the most common aggregation method for multiple rules, which the usage of the maximum function
Python notation |
Logical notation |
Interpretation |
|---|---|---|
[X, Y, …] |
{X, Y, …} |
x, y, …: max(x, y) |
Defuzzification
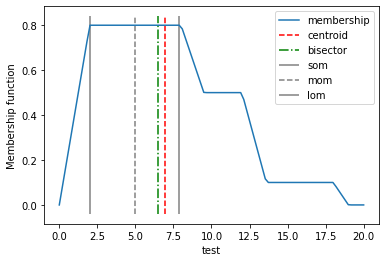
Defuzzification is the last stage of the Fuzzy Inference System, where the fuzzy output is mapped into a crisp output using one of the available procedures. Available options are:
centroid: Analog to the center of mass.
bisector: Value separating two portions of equal area under the membership function.
mom (middle of maximum): Middle (median) of the set of values whose images are the maximum of the membership function.
som (smaller of maximum): Smaller (min) of the set of values whose images are the maximum of the membership function.
lom (largest of maximum): Largest (max) of the set of values whose images are the maximum of the membership function.
The following plot illustrates the different methods using a custom Fuzzy Set, matching the one from https://www.mathworks.com/help/fuzzy/defuzzification-methods.html
[4]:
test = zadeh.FuzzyVariable(
    zadeh.FloatDomain("test", 0, 20, 100),
    {
        "membership": 0.8 * zadeh.TrapezoidalFuzzySet(0, 2, 8, 12)
        | 0.5 * zadeh.TrapezoidalFuzzySet(5, 7, 12, 14)
        | 0.1 * zadeh.TrapezoidalFuzzySet(12, 13, 18, 19),
    },
)
test.plot()
lims=plt.ylim()
plt.vlines(test.domain.centroid(test.values["membership"]), *lims, color="r", ls="--", label="centroid")
plt.vlines(test.domain.bisector(test.values["membership"]), *lims, color="g", ls="-.", label="bisector")
plt.vlines(test.domain.som(test.values["membership"]), *lims, color="gray", ls="-", label="som")
plt.vlines(test.domain.mom(test.values["membership"]), *lims, color="gray", ls="--", label="mom")
plt.vlines(test.domain.lom(test.values["membership"]), *lims, color="gray", ls="-", label="lom")
plt.legend()

plt.show()
To set any of this methods in a FIS, just use the defuzzification kwargs in its construction.
[ ]: